pacman::p_load(plotly, ggtern, tidyverse)Hands-on_Exercise5_part1
13 Creating Ternary Plot with R
13.1 Overview
Ternary plots are a way of displaying the distribution and variability of three-part compositional data. (For example, the proportion of aged, economy active and young population or sand, silt, and clay in soil.) It’s display is a triangle with sides scaled from 0 to 1. Each side represents one of the three components. A point is plotted so that a line drawn perpendicular from the point to each leg of the triangle intersect at the component values of the point.
Install and launch tidyverse and ggtern packages.
Derive three new measures using mutate() function of dplyr package.
Build a static ternary plot using ggtern() function of ggtern package.
Build an interactive ternary plot using plot-ly() function of Plotly R package.
13.2 Installing and launching R packages
13.3 Data Preparation 13.3.2 Importing Data
To important respopagsex2000to2018_tidy.csv into R, read_csv() function of readr package will be used.
#Reading the data into R environment
pop_data <- read_csv("data/respopagsex2000to2018_tidy.csv")
13.3.3 Preparing the Data
Next, use the mutate() function of dplyr package to derive three new measures, namely: young, active, and old.
#Deriving the young, economy active and old measures
agpop_mutated <- pop_data %>%
  mutate(`Year` = as.character(Year))%>%
  spread(AG, Population) %>%
  mutate(YOUNG = rowSums(.[4:8]))%>%
  mutate(ACTIVE = rowSums(.[9:16]))  %>%
  mutate(OLD = rowSums(.[17:21])) %>%
  mutate(TOTAL = rowSums(.[22:24])) %>%
  filter(Year == 2018)%>%
  filter(TOTAL > 0)
13.4 Plotting Ternary Diagram with R
13.4.1 4.1 Plotting a static ternary diagram
Use ggtern() function of ggtern package to create a simple ternary plot.
#Building the static ternary plot
ggtern(data=agpop_mutated,aes(x=YOUNG,y=ACTIVE, z=OLD)) +
  geom_point()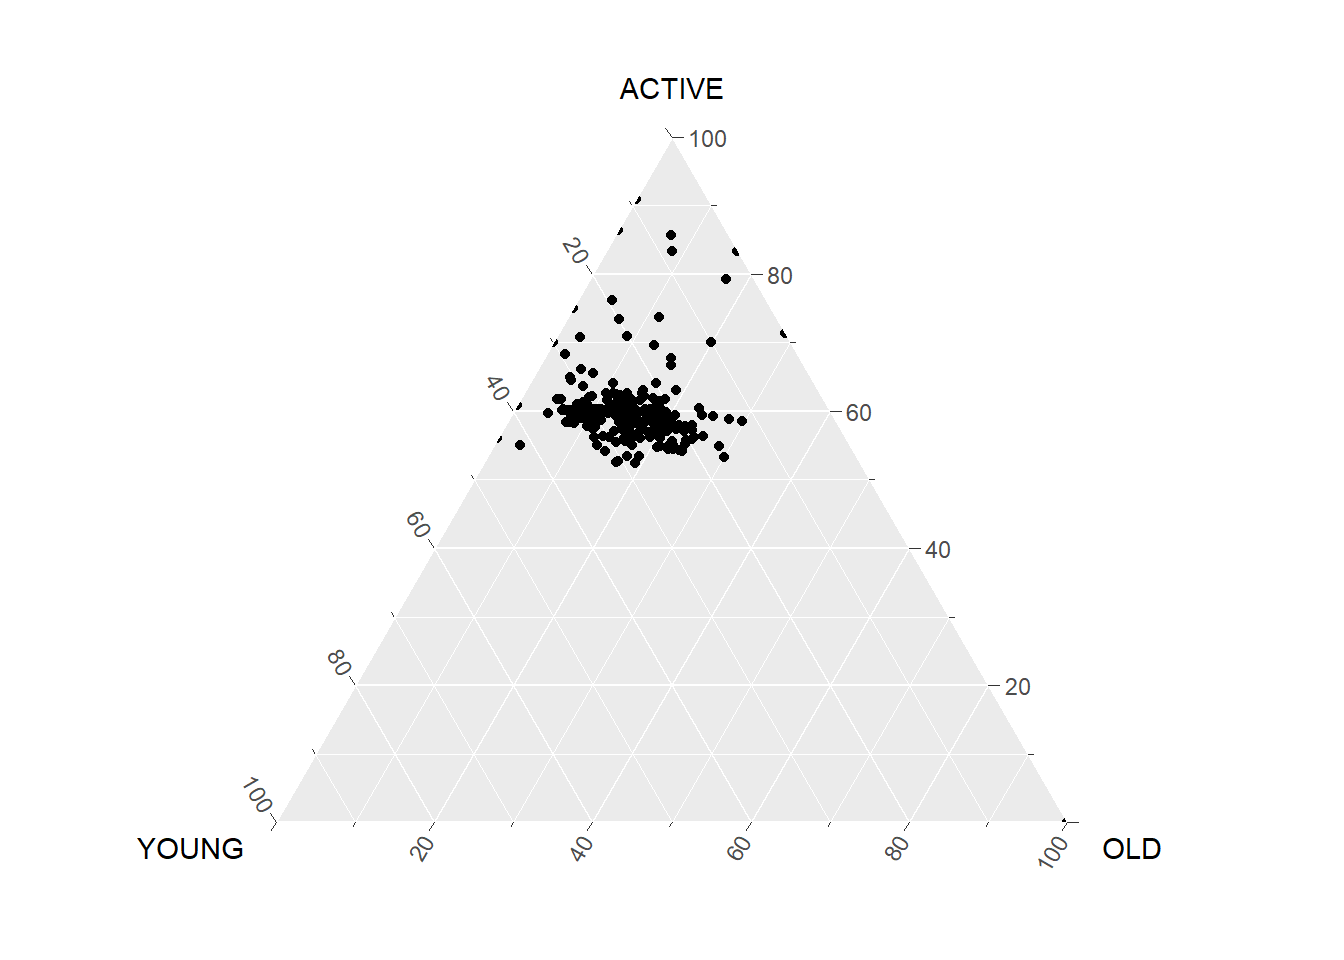
#Building the static ternary plot
ggtern(data=agpop_mutated, aes(x=YOUNG,y=ACTIVE, z=OLD)) +
  geom_point() +
  labs(title="Population structure, 2015") +
  theme_rgbw()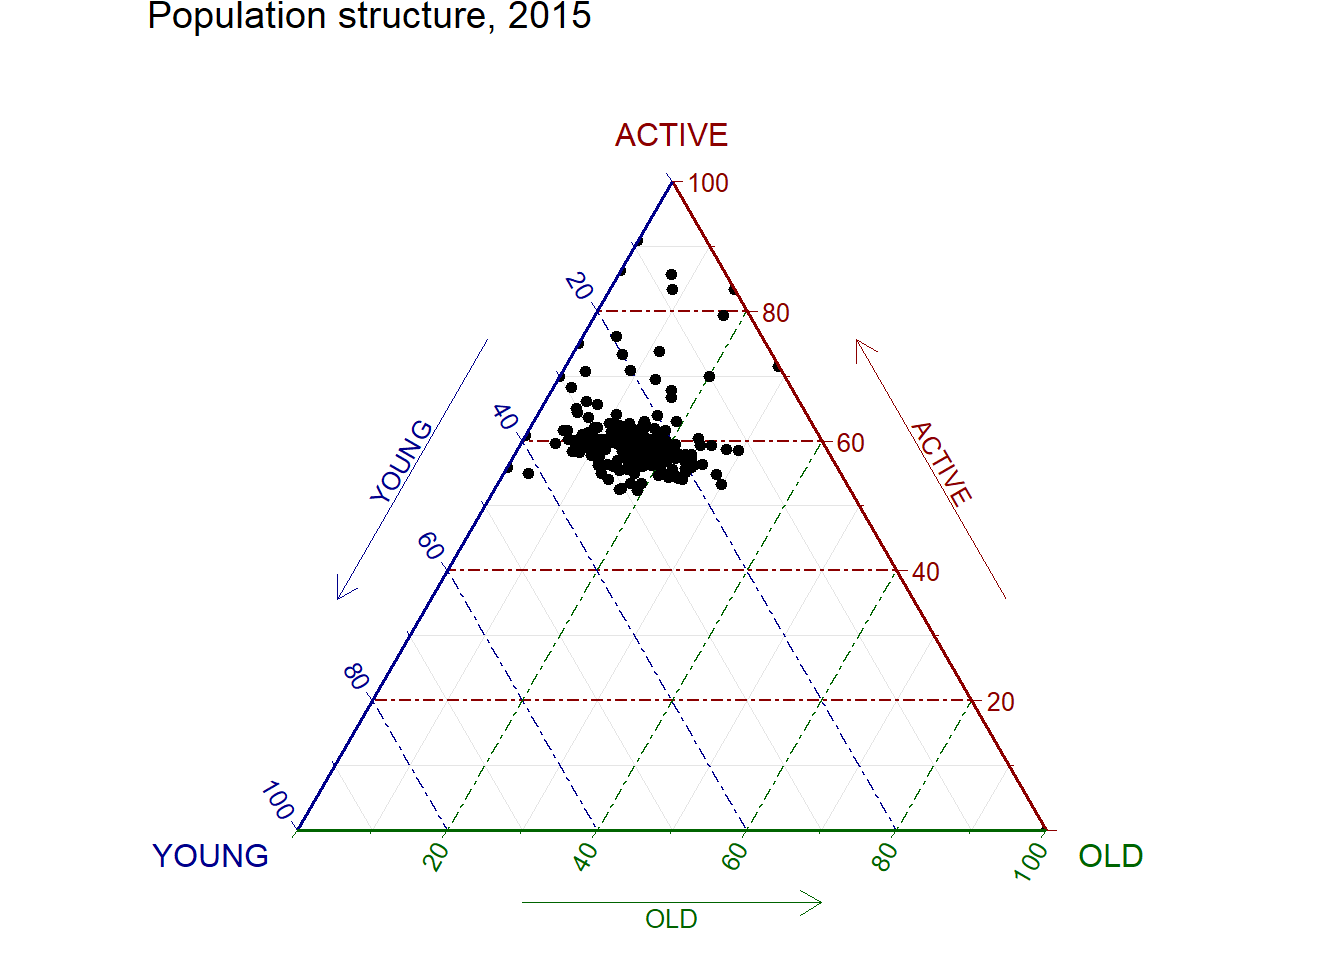
13.4.2 Plotting an interative ternary diagram
The code below create an interactive ternary plot using plot_ly() function of Plotly R.
# reusable function for creating annotation object
label <- function(txt) {
  list(
    text = txt,
    x = 0.1, y = 1,
    ax = 0, ay = 0,
    xref = "paper", yref = "paper",
    align = "center",
    font = list(family = "serif", size = 15, color = "white"),
    bgcolor = "#b3b3b3", bordercolor = "black", borderwidth = 2
  )
}

# reusable function for axis formatting
axis <- function(txt) {
  list(
    title = txt, tickformat = ".0%", tickfont = list(size = 10)
  )
}

ternaryAxes <- list(
  aaxis = axis("Young"),
  baxis = axis("Active"),
  caxis = axis("Old")
)

# Initiating a plotly visualization
plot_ly(
  agpop_mutated,
  a = ~YOUNG,
  b = ~ACTIVE,
  c = ~OLD,
  color = I("black"),
  type = "scatterternary"
) %>%
  layout(
    annotations = label("Ternary Markers"),
    ternary = ternaryAxes
  )